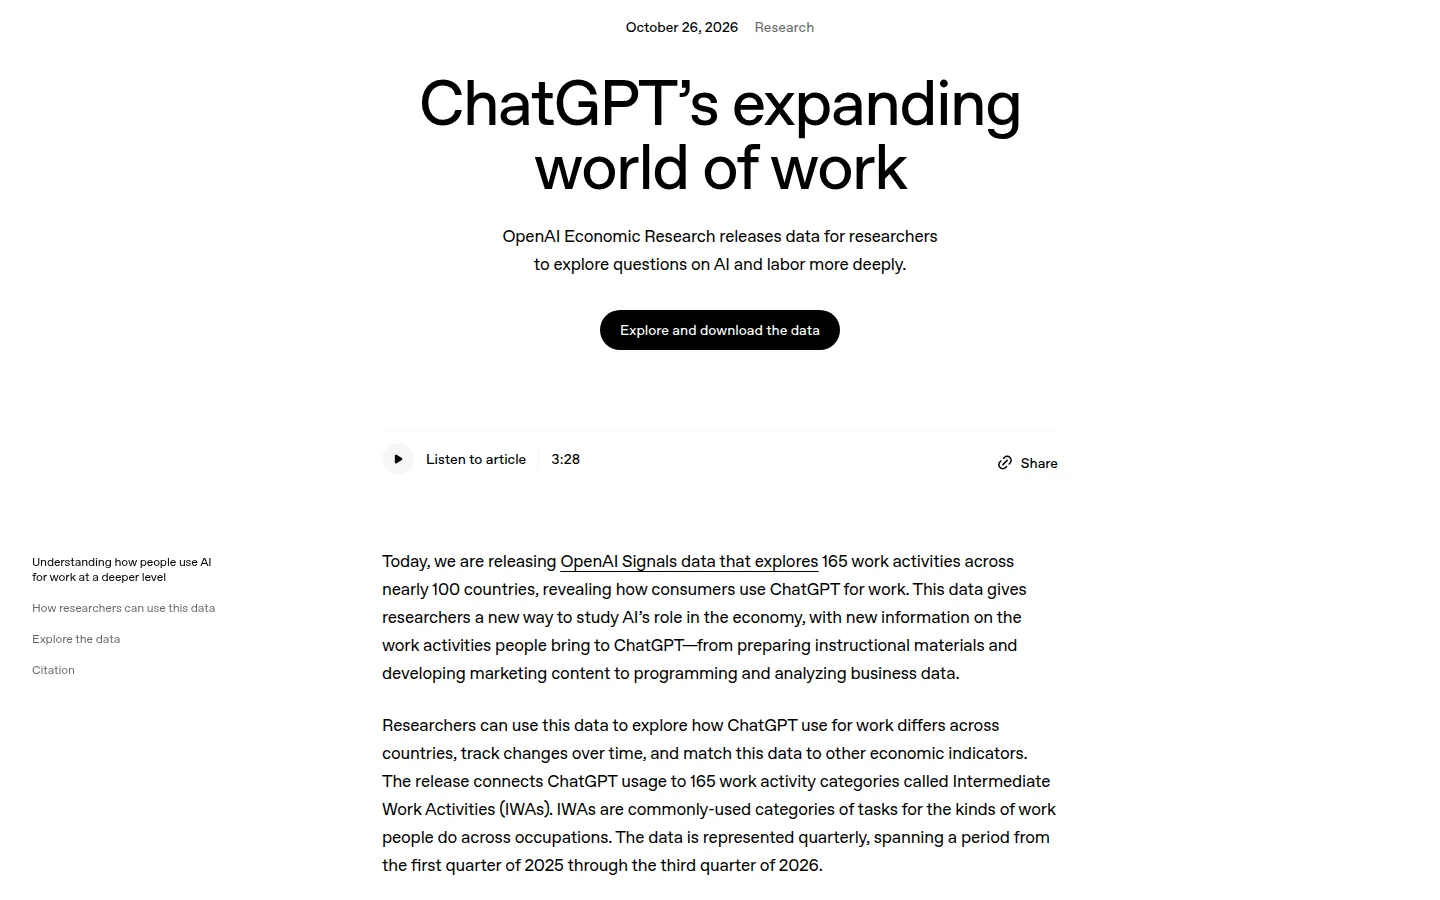
OpenAI published OpenAI Signals on October 26, 2026, a dataset from its economic research team that maps work-related ChatGPT messages to 165 work activities across nearly 100 countries. The data is quarterly, runs from the first quarter of 2025 through the third quarter of 2026, and OpenAI offers it as a download. The company’s headline reading is that work use has become less concentrated: across the 74 countries observed in every quarter, the ten most common activities averaged 51.1% of each country’s classified work messages in Q3 2026, down from 56.0% in Q1 2025.
What was actually released
No model, no feature and no price change. What OpenAI released is a measurement: a set of statistics that connects ChatGPT usage to 165 task categories it calls Intermediate Work Activities, or IWAs. Those categories are built on O*NET, the U.S. Department of Labor framework that groups occupation-specific tasks into broader activity categories. Borrowing a public taxonomy is the point: shared categories let a researcher set ChatGPT usage beside employment data built on the same spine.
The release ships with an interactive explorer, country by country, that goes from broad activity groups down to individual tasks across seven quarters. A second view sets the ChatGPT distribution beside the activities actually performed across U.S. jobs.
| Dimension | What OpenAI publishes |
|---|---|
| Work activities | 165, grouped as Intermediate Work Activities built on O*NET |
| Countries | nearly 100, of which 74 are observed in every quarter |
| Period | Q1 2025 to Q3 2026, quarterly |
| Plans in scope | work-related messages on individual ChatGPT plans |
| Out of scope | enterprise messages and Codex use |
| Concentration | 51.1% of classified work messages in the top ten activities per country, Q3 2026 |
| Access | interactive chart in the page, plus a data download for researchers |
Read from the announcement page on October 26, 2026. The 51.1% is the average across the 74 countries present in every quarter, not a share of all ChatGPT messages.
What to take from the release
- Work use is spreading: the ten most common activities fell from 56.0% to 51.1% of classified work messages across the 74 countries observed every quarter.
- The series is quarterly, covers seven quarters, and comes with a download, which most vendor research does not offer.
- Countries are not converging on the same tasks. OpenAI reports that countries tended to specialize in different kinds of work over time.
What the claim rests on
The concentration figure is an average of country-level averages, and the page publishes the aggregate, not the distribution behind it. A 4.9-point drop in the top ten’s share is consistent with work use spreading into a longer tail, and it is also consistent with a handful of large markets moving while most countries stay flat. A reader cannot tell which from the page: the country values live in the interactive chart, not a published table, and no interval around the average is given.
The second measure is thinner than it looks. OpenAI argues that countries specialized differently over time. Its chart carries two printed values for the average total variation distance, 22.2% and 23.0%, over the seven quarters it plots. A 0.8-point movement on that scale is small, and the prose attaches neither number to a named quarter, so the trend rests on the chart alone.
The measurement is also automated. Messages are classified into activities by automated systems after identifying information is removed, which the page presents as a privacy measure. It is a methodological one too: the shares above measure the classifier’s assignments as much as they measure behavior, and the page publishes no accuracy figure and no audit of the labels. If the boundary between analyzing business data and developing marketing content drifts between quarters, concentration moves without anyone changing what they do at work.
Across 74 countries observed in every quarter, the ten most common activities represented an average of 51.1% of each country’s classified work messages in Q3 2026, down from 56.0% in Q1 2025.
The comparison with the U.S. economy is partial by construction. About 43% of the employment-weighted task mix for mapped U.S. occupations falls into categories the release groups as other IWAs, outside the individually reported ones: moving materials, operating vehicles, maintaining health or medical records. They did not clear OpenAI’s threshold for consistent representation in its U.S. sample, so they form the part of American work the chart cannot see.
What OpenAI does not publish
No volumes: message counts, user counts and revenue are absent, so no share can be turned into an estimate of how much work is being done. No enterprise or Codex data, which is the surface companies pay for. No classifier accuracy and no audit of the labels. And no per-country table and no error bars behind either concentration measure, which is what would make the two trends checkable rather than directional.
On this page
What it changes for AI tool buyers
Three decisions follow.
The first is the breadth of an evaluation. If the average country’s work use now spreads across a longer list of activities, the buying question shifts from which model wins a benchmark to which tool holds up across the five tasks a team actually brings. A model that is convincing in a demo and mediocre on the third and fourth weekly task is the expensive one, and that is where the volume is going.
The second is segment. The dataset measures individual plans only. If you buy for a company, public evidence about how businesses use AI still comes mostly from vendor case studies, and a case study measures one deployment picked for publication. The only measurement that describes your usage is the one you ask your vendor for: seats, tasks, retention, and what happens to a seat that goes unused.
The third is how to read job exposure numbers. Because 43% of the U.S. occupational task mix sits outside the mapped activities, thin ChatGPT activity in a sector is not evidence that those jobs are out of reach. It often means the work is physical or records-based, and was never measured.
One caution for market sizing: treat the shares as ordered, not precise. The direction is supported, the decimals are not.
The Neural Minute take
Our own material points the same way from the other side of the table. We cover a steady stream of vendor deployments, and each describes one rollout chosen for publication: a law firm building a contract reviewer, a security team cutting patch time, a retailer reporting an engagement gain, a database company counting seats (one recent example). Each is real and each is a best case, and a buyer is not joining a best case. The value of this release is that it measures the distribution a buyer actually joins, which is why we would rather point a reader here than at another customer story.
The second thing worth noticing is what OpenAI chose to publish. Labor market evidence has become a marketing surface, and the honest test of a release like this is its omissions: no enterprise data, no Codex, no accuracy figure. A dataset that stops exactly where the paid product starts is a dataset about consumers, not about work as companies buy it.
That sets a rule we already apply: cite the number that moves least flatteringly. Here it is the 0.8 points of between-country variation and the missing accuracy figure, not the 4.9-point decline.
Sources
- ChatGPT’s expanding world of work, OpenAI, October 26, 2026. The announcement, the figures and the interactive chart quoted above.
- OpenAI Signals data download, OpenAI, Signals v3.0. The dataset and its methodology note, cited by the announcement.