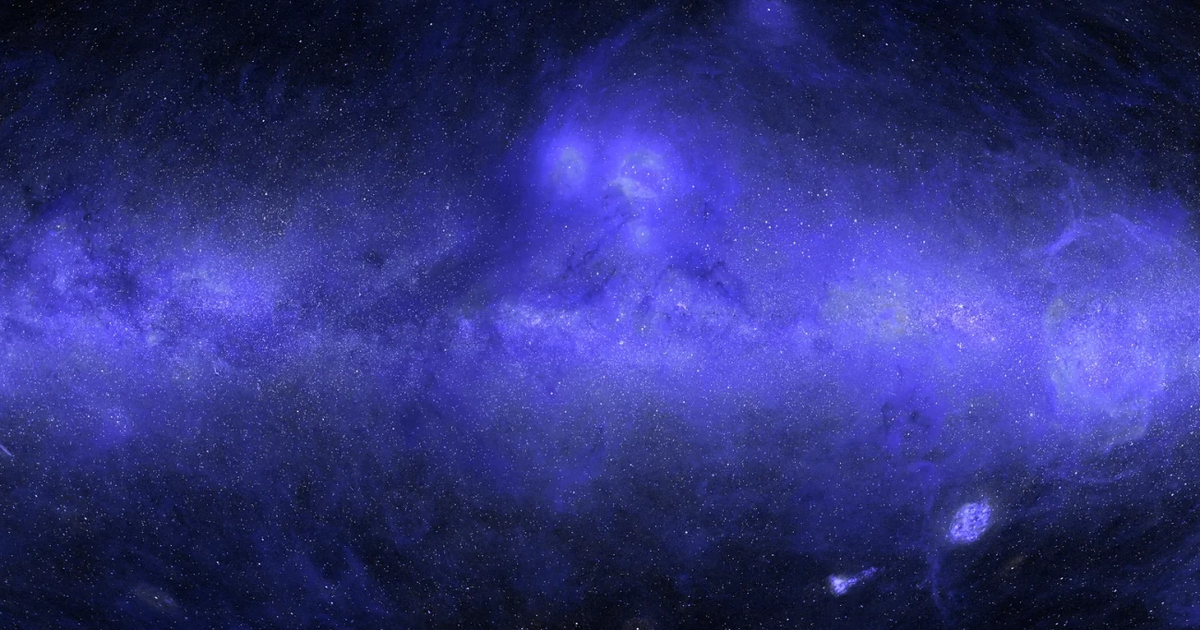
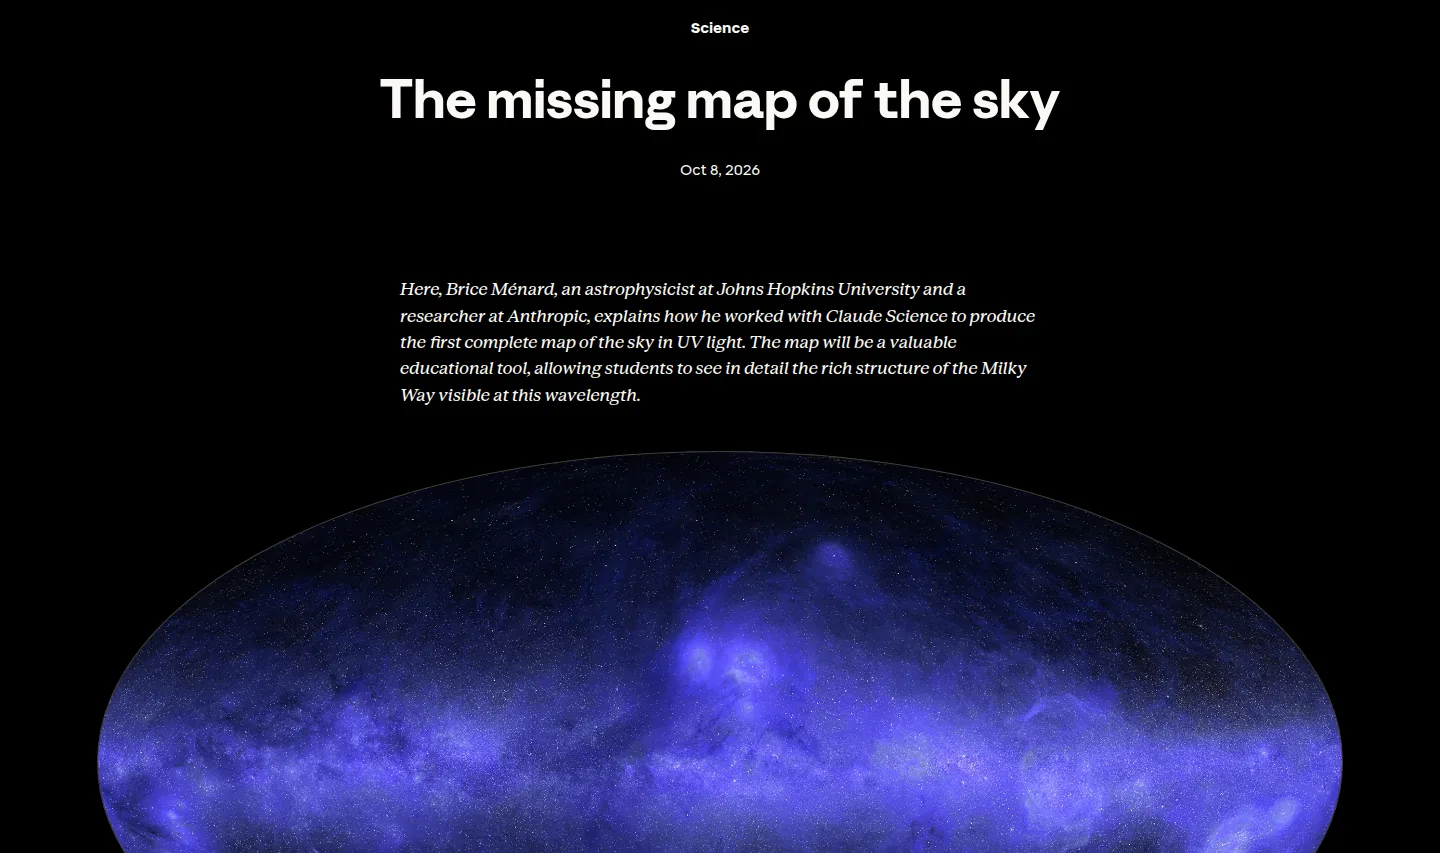
Anthropic published a research feature on October 8, 2026, describing how one of its own researchers used Claude Science to build the first complete map of the sky in ultraviolet light. The astrophysicist, Brice Menard of Johns Hopkins University, worked with the tool to merge decades of archived telescope data and fill the roughly one third of the sky that no UV telescope has ever observed. The map is public and dated, and the accuracy behind its filled-in parts is the researcher’s own figure.
What was actually released
The release is a research feature and a map, not a new product. Claude Science is an app Anthropic announced on June 30, 2026, and this page shows what one scientist did with it across a single summer. The map shows the whole sky in ultraviolet, centered on the galactic center, combining far-UV at 154 nanometers and near-UV at 232 nanometers.
The page says the tool orchestrated a team of agents that gathered public UV surveys, put them on a common scale, cross-calibrated them, and merged them into one map. The largest input is NASA’s GALEX mission, which ran from 2003 to 2013 and imaged about two-thirds of the sky in some 38,000 observations, skipping bright-star regions including the plane of the Milky Way. Smaller pieces came from NASA’s Swift, South Korea’s FIMS/SPEAR, and Europe’s TD-1.
Then came the part that matters. Roughly a third of the sky had never been observed in UV, so there was nothing to merge there. The researcher asked Claude Science to use inpainting, a machine-learning method that restores missing parts of an image from its surroundings, to estimate the UV brightness that should be present from observations at other wavelengths. The page then added UV estimates for more than 100 million individual stars, inferred from the European Space Agency’s Gaia satellite, and shipped the map with layers that label each pixel as measured or predicted and give uncertainty estimates.
What is actually new here
- It is a use case, not a product: Claude Science shipped on June 30, 2026, and this is one researcher’s result.
- The map separates what was measured from what was predicted, per pixel, instead of presenting one flat image.
- The number worth keeping is the fill rate: about a third of the sky had no UV telescope data at all.
What the claim rests on
Every number is the publisher’s, and the headline rests on one line that is easy to read past: the model estimated the hidden data to within about 10% of the real UV measurements. That is a strong result, produced by a test run inside the project rather than a measurement anyone outside repeated. The researcher took regions where UV data already exists, hid parts, and had the model reconstruct the image without the real values.
| Figure as published | What it covers | Independent check |
|---|---|---|
| About a third of the sky | filled by prediction, never observed in UV | none published |
| About two-thirds of the sky | covered by NASA GALEX before filling | public archive |
| 38,000 observations | NASA GALEX pointings, 2003 to 2013 | public archive |
| Within about 10% | predicted brightness against hidden real data | a self-run test |
| More than 100 million stars | added from ESA Gaia visible-light data | public archive |
What the page does not give is the sample size, the period, the definition of the error, or a distribution of results. So the 10% is best read as the researcher’s own backtest on held-out regions, not an error bar for the whole map.
Roughly a third of the sky has never been observed in UV.
The page is explicit about that too: about a third of the map, including much of the galactic plane, was predicted rather than observed. Complete, in other words, means the image has no blank pixels; it does not mean every pixel was measured.
What is not published
The page gives no sample size and no period for the hidden-region test, no aggregate error for the map as a whole, and no statement of whether the accuracy figure is an average across regions or a worst case. No peer review is named, and no second group has reproduced the pipeline on the same public data.
On this page
What it changes for research teams using AI
For a research team, the pattern is the one the researcher names himself: a project that is useful but low priority, the kind that stays at the bottom of the list because doing it properly takes weeks of painstaking calibration at the level of individual pixels. Here the human set direction and checked the result, and agents ran the computation nobody wants to do by hand.
The second change is the audit trail. The map does not ship a picture alone; it ships a label per pixel and an uncertainty estimate, plus a diagram of how data flowed from public inputs to the result. For a team that has to defend a figure, that provenance is the valuable part, and it is what a bare image lacks.
On cost, this is a case study, not a price list: the page carries no rate for the work. What can be compared is the job being replaced, weeks of careful calibration against days in which one person directed the effort and the agents ran it. If you already pay for Claude Science inside a Pro, Max, Team, or Enterprise plan, the comparison is against your own staff time, not a new line on an invoice.
The Neural Minute take
What we can add is our own habit of reading numbers on the publisher’s page, dated. We did it for Claude Haiku 5.5 and for Google’s Gemini agent, and we do it here: the 10% is read on Anthropic’s own page, published October 8, 2026, and it is the researcher’s figure, not a measurement a second group repeated.
The interesting thing is not the image but the label. The map tells you which pixels are observations and which are guesses, per pixel, with an uncertainty estimate. That is the standard to ask of any AI output that feeds a decision, and it is rarer than it should be. A tool that will not say where it measured and where it guessed is the one to distrust, whether it draws a sky map or a revenue forecast.
The word complete will be read as measured, and it does not mean that. The honest reading is a map with no blank pixels, about a third of it inferred, and that gap is where the uncertainty lives.
One reservation about the framing. Supplier before-and-after figures have filled several stories this week, from OpenAI Daybreak to Google’s agent. This page is different in kind, because the method is shown and the input data is public, which is why it is worth more than the others. But the accuracy still comes from the company that wants the result to be true, so treat it as a strong signal, not a settled fact, until an independent group runs the same pipeline.
Sources
- Using Claude Science to produce the first complete map of the sky in UV light, Anthropic, published October 8, 2026: https://www.anthropic.com/research/the-missing-map-of-the-sky
- Claude Science, an AI workbench for scientists, Anthropic, published June 30, 2026, the source for the product date: https://www.anthropic.com/news/claude-science-ai-workbench
- The 38,000 GALEX observations, the roughly one-third share filled by prediction, the 154 nm and 232 nm bands, the within-10% figure, and the more than 100 million Gaia stars are read on Anthropic’s page on October 9, 2026, and reproduced as the publisher’s own statements, not as independent measurements